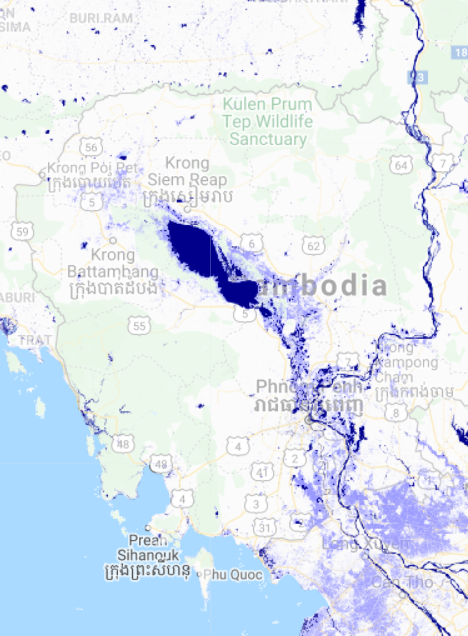
The Surface Water Mapping Tool works by merging data from different Landsat satellite missions, providing a dataset that spans from the present day all the way back to 1984, which is also continuously being updated. A stack of images is created for the time period selected by the user. The resulting water maps are loaded into the web application and displayed on top of the background map. The map calculated from the 40th percentile map represents permanent water (within the selected time period) and the map calculated from the 8th percentile map represents temporary water. Permanent water mostly represents reservoirs, lakes and rivers (that did not change a lot over the selected time period). Temporary water most often represents (seasonally) inundated land, such as wetlands, rice fields or fish ponds. It can also be an indication of floods or changes in water bodies.